This runbook focuses on integration monitoring for automation owners responsible for several connected systems. It describes concrete choices for health signals, correlation IDs, freshness checks, alert routing, replay strategies, and incident review. The opening guidance explains why each signal matters, how it maps to implementation decisions, and which verification steps detect the specific failure modes that cause business data to stop moving.
integration monitoring: define health signals first
Decide a minimal set of health signals that represent data flow health rather than component-only metrics. Use event-rate (messages/min by pipeline), end-to-end latency (ingest to acknowledgement), and error-rate (percent failed or retried) as primary signals. Implementation logic: emit counters and histograms from each integration node to your observability backend; tag them by pipeline, message type, and environment. Failure modes: gaps in event-rate often indicate upstream producer outages or webhook delivery failures, while latency spikes point to backpressure or auth throttling. Verify by correlating drops with downstream consumer logs.
Correlation IDs: design and propagation
Adopt a single correlation ID per business transaction and propagate it across services synchronously and asynchronously. Implementation: prefer a header name like X-Correlation-ID for HTTP and include a correlation_id field in message payloads for brokered messages; ensure generation at the gateway or producer. Follow HTTP semantics for headers (see RFC 9110) when propagating over HTTP. Failure modes include missing IDs, ID loss during retries, or multiple IDs created mid-flow; handle these by rejecting messages without IDs or by stamping a new ID and logging the parent information. Verify by tracing a sample request through logs and traces.
Freshness checks and heartbeat probes
Implement freshness checks that detect when expected data stops arriving. Logic: define expected cadence per feed (e.g., customer-update events every 5 minutes) and implement heartbeat messages or synthetic probes when the upstream system cannot generate them. Failure modes include clock drift, network partitions, or undelivered webhooks; mitigate by using monotonic timestamps and TTLs, and by detecting stale messages older than a configured window. Verification steps: synthetic probes should appear in metrics and trigger a degraded alert when missing for two consecutive intervals.
Alert routing, deduplication, and escalation
Define clear alerting rules tied to business-impact thresholds, not just technical thresholds. Implementation: map signals (event drop, sustained error-rate > X%, replay backlog growth) to severity levels, and route them to the responsible escalation path (owner on-call, backup, platform team). Include deduplication windows to avoid alert storms and annotate each alert with runbook links and the correlation ID context. Failure modes include alert fatigue and missing owner coverage; verify routing by firing a synthetic alert and confirming the on-call workflow and paging behavior.
Replay strategy for failed messages
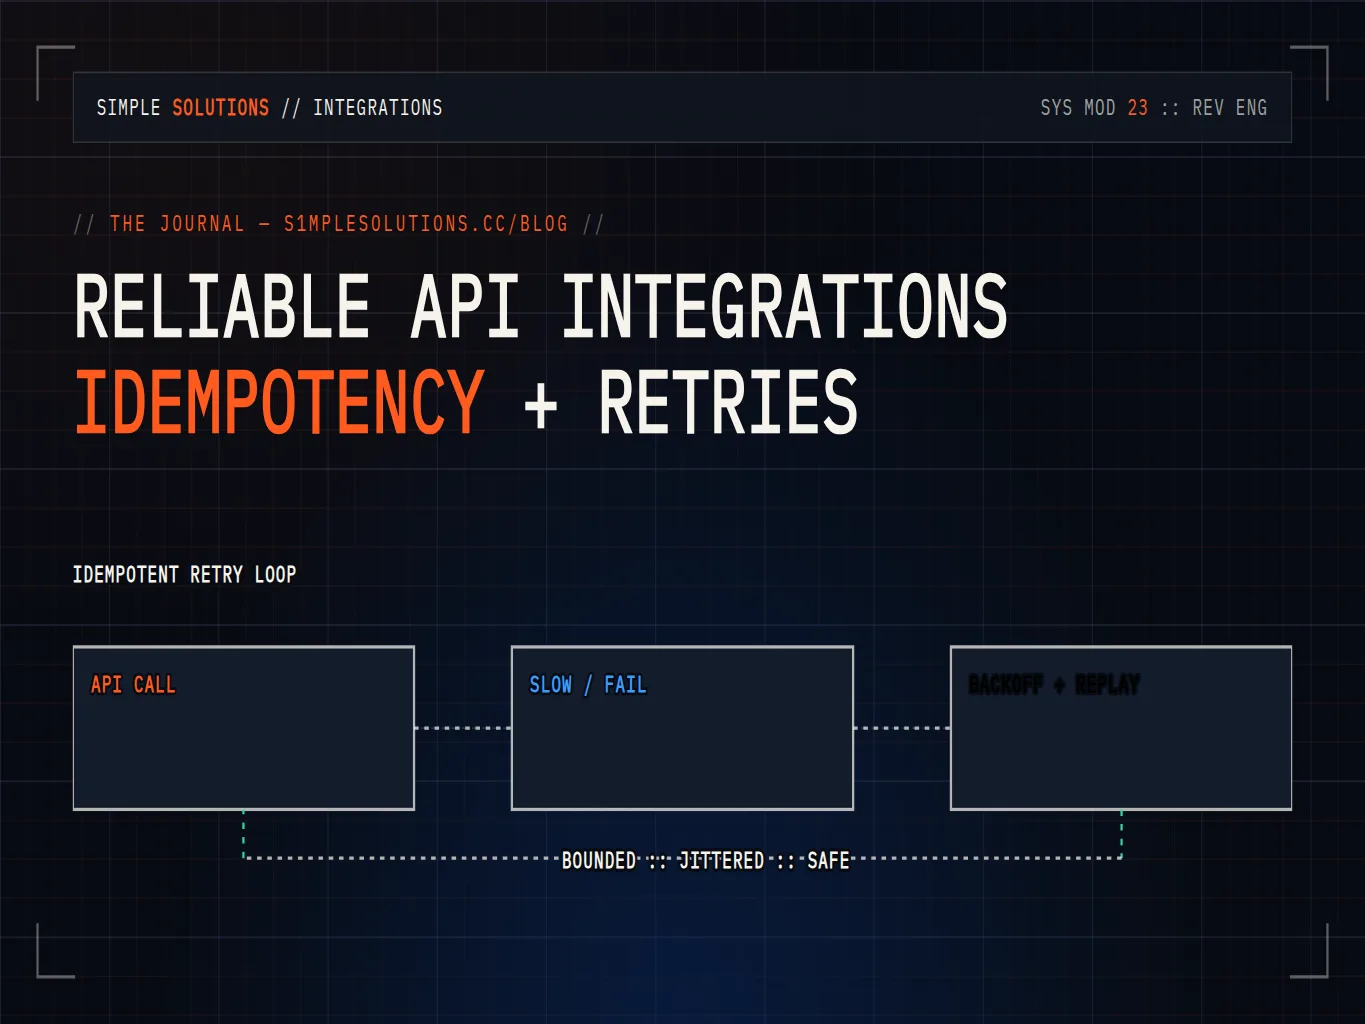
Design replay semantics before you need them. Implementation choices: retain raw messages in an append-only store for a retention window that covers expected incident timelines, or maintain a durable dead-letter queue with metadata for replay. Enforce idempotency by including an idempotency key derived from the business ID and version, and make replay tools apply messages in original order when required. Failure modes include duplicates, out-of-order application, and side-effect replay; verify by running a replay in a staging environment and asserting idempotent outcomes against a snapshot of downstream state.
Observability instrumentation and structured logs
Instrument integration code with structured logs, traces, and metrics that include the correlation ID and pipeline tags. Implementation details: JSON logs with specific fields (timestamp, correlation_id, pipeline, step, error_code) and distributed trace context propagated according to your tracing system. Failure modes include missing context when services drop headers or parse errors in logs; mitigate by validating log output during deployments and running log quality checks. Verification: query logs for a sample correlation ID and confirm that each pipeline stage emits an expected log entry.
Authentication, throttling, and webhook patterns
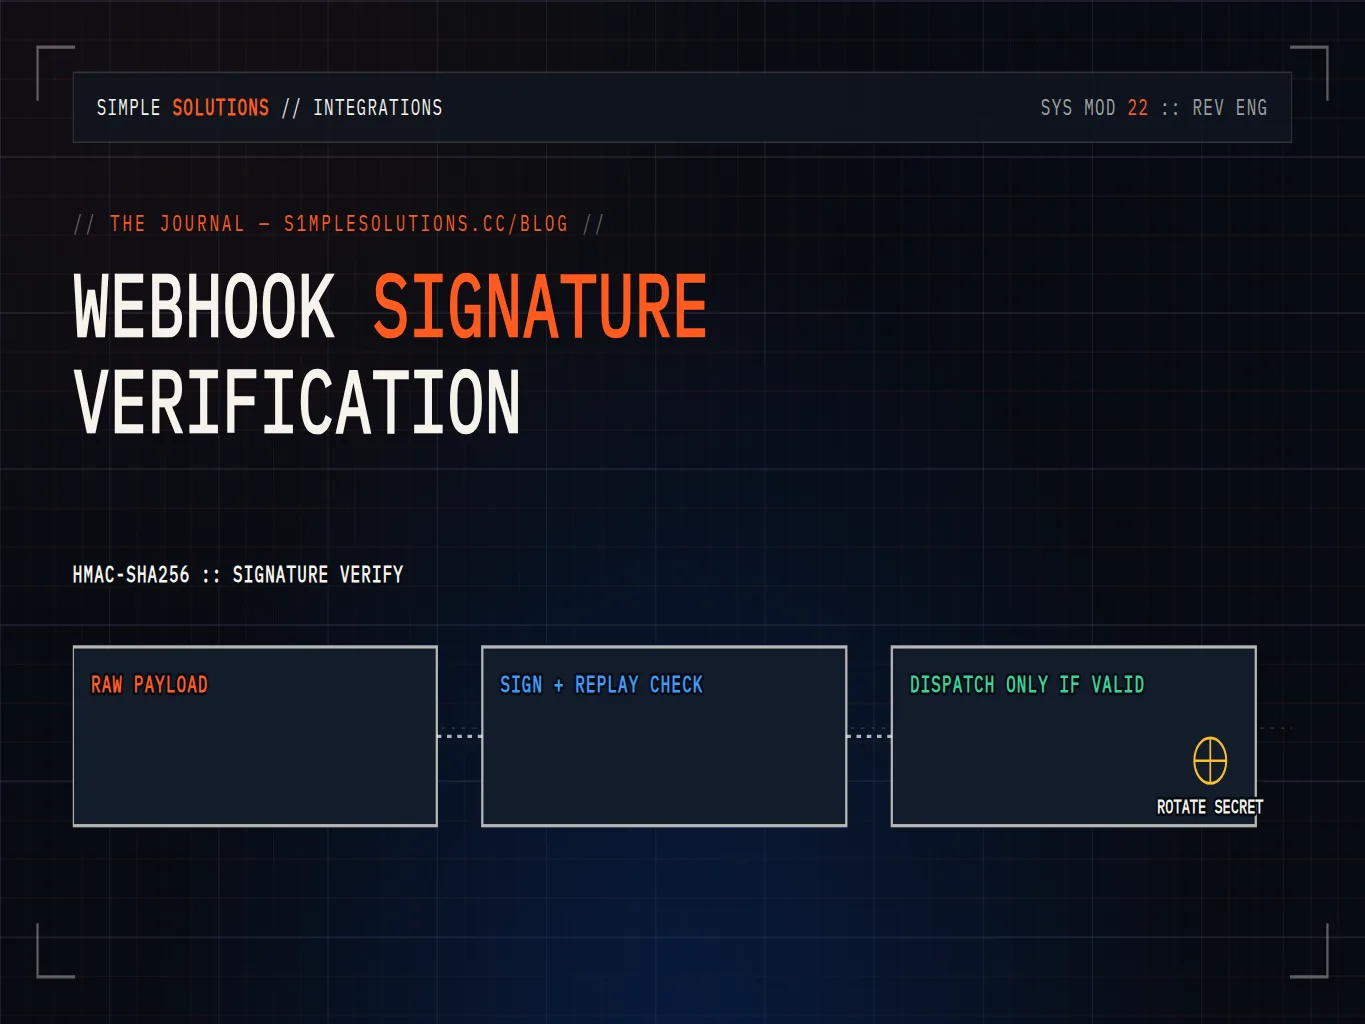
Ensure integrations handle auth failures and throttling gracefully. Implementation: follow OAuth 2.0 flows for token management and refresh (see RFC 6749) and implement exponential backoff with jitter for rate-limited endpoints. For webhooks, follow best practices for delivery retries and signature validation (see W3C Webhooks guidance) and record delivery status to detect blackholed endpoints. Failure modes include token expiry and permanent webhook 410 responses; verify by simulating token revocation and observing automatic refresh and alerting on repeated webhook failures.
When business data stops moving, the signal is usually in the silence: missing heartbeats, zero event-rate, or repeated retry failures — instrument for silence as explicit state.
SLOs, business-impact thresholds, and verification
Translate technical signals into SLOs that reflect customer impact (e.g., 99% of lead records delivered within 2 minutes). Implementation: create monitoring rules that calculate error budgets and alert before SLOs are breached. Failure modes include misaligned SLOs that are too lenient or too strict; verify SLOs by correlating incidents with customer-facing issues and adjusting thresholds after a few incident cycles.
Incident review, RCA, and runbook updates
After any incident where data flow paused or degraded, run a structured post-incident review. Implementation: collect timeline (timestamps and correlation IDs), identify root cause, document corrective actions, and update the runbook with precise commands and queries used during the incident. Failure modes include incomplete timelines or missing artifacts; verify postmortems by confirming action items have owners and deadlines, and by scheduling a follow-up audit to ensure runbook steps still work.
Operational runbook checklist
Maintain a short checklist for responders: identify the correlation ID, check event-rate and freshness dashboards, inspect dead-letter queues, attempt safe replay in staging, and notify impacted teams. Implementation details: store the checklist in an accessible runbook repository and automate initial checks with scripts that return a diagnostic summary. Failure modes include stale checklists or missing scripts; verify by conducting quarterly drills where teams practice the checklist and time the mean time to recovery.
Verification tooling and automation
Automate verification via synthetic tests and health probes that run end-to-end with correlation IDs and idempotency keys. Implementation: schedule probes that exercise each critical integration path and report into the same observability system as production metrics. Failure modes include probes masking real failures because they are too synthetic; mitigate by mixing synthetic and real traffic checks and by validating probe results against production event rates. Verify test coverage by tracking probe success rates and correlating probe failures with real incident logs.
Integrations hygiene and periodic system audit
Apply periodic hygiene: rotate credentials, prune obsolete webhooks, and audit retention policies. Implementation: link hygiene tasks with your system audit schedule and automate credential expiry warnings. Failure modes include credential sprawl or forgotten endpoints; verify hygiene with automated audits and by using a centralized registry of integrations to detect unmonitored flows.